Insight into the world
through data.
Inside Crop Monitoring
Live product, in operation today · crop.datawatongchal.com ↗
Global crop monitoring at a glance
An interactive 3D globe streams crop health worldwide. Hundreds of monitoring cells per region are color-coded by SVI — Excellent (≥80) through Critical (<15) — so users can spot stress hotspots without ever leaving the overview.

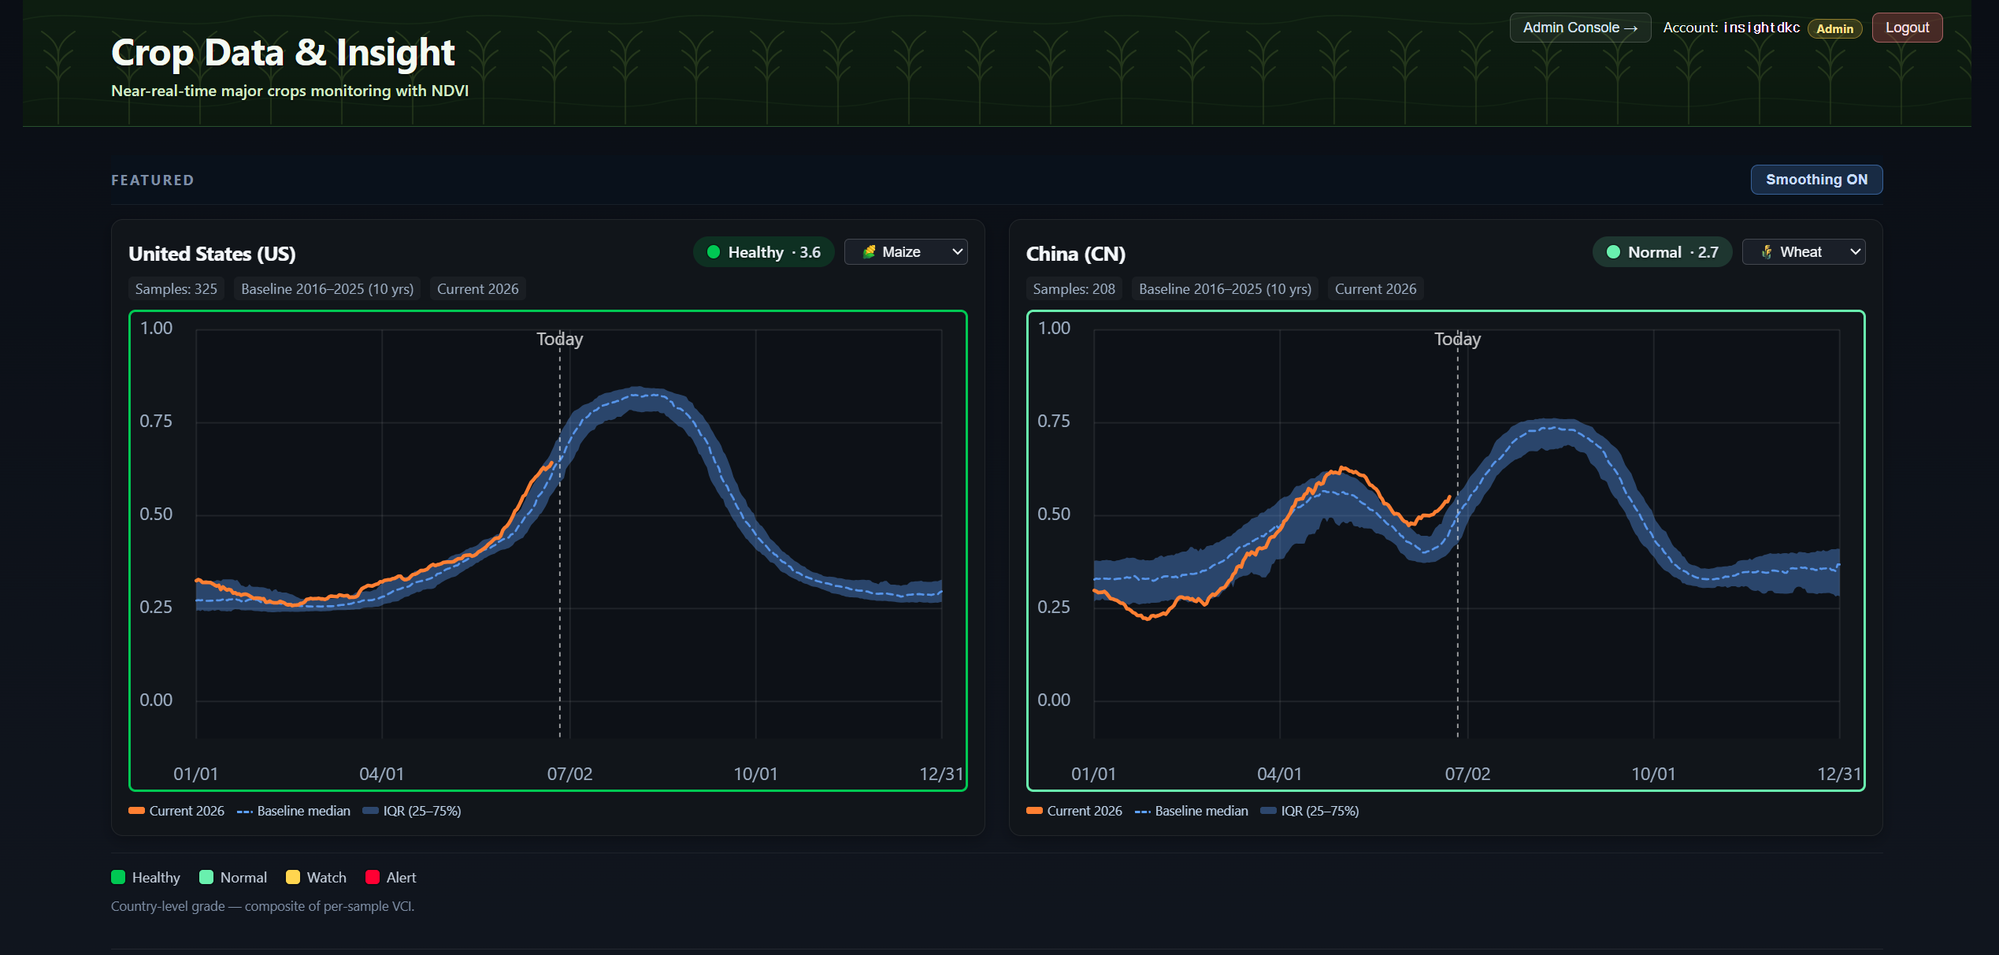
Country-level NDVI with 10-year baseline
For each country and crop, compare this year (orange) against a 10-year baseline median (2016–2025) and its 25–75% IQR band. A composite VCI grade ranks the country Healthy / Normal / Watch / Alert at a glance.

Per-cell phenology with multi-year overlay
Drill into any single cell to see Start-of-Season, Peak, and End-of-Season auto-detected against eleven historical years. Toggle each year, smooth the curve, zoom, and compare side by side.

Built-in AI analysis agent
Select any cell and ask the agent: “Why does this cell differ from the baseline?”, “What should I watch next?” — get expert-grade NDVI analysis in natural language, grounded in that cell’s actual data.

Curated agricultural news feed
Per-country, per-crop news that may move yields and prices — 397+ articles indexed for United States · Maize alone. Surface market-moving signals (policy, weather, supply chain) before they show up in NDVI.

How it works
From raw data to actionable insight.
-
1
Data in
Satellite imagery, public datasets, and domain-specific sources are ingested and normalized.
-
2
AI analytics
An LLM-powered guide layers natural-language interaction on top of interactive maps, charts, and tables.
-
3
Insight out
You get answers, dashboards, and alerts you can act on — not just numbers.
About
데이터와통찰 — “Data and Insight” in Korean.
DATAWATONGCHAL (데이터와통찰) is Korean for “Data and Insight.” Our mission is simple: insight into the world through data — and put that insight in the hands of the people who need it most.
We start with domains where data already exists but insight does not — agriculture (satellite imagery is everywhere, but actionable crop intelligence is not) — and expand from there. Every product pairs interactive visualization with an AI guide so non-experts can explore data the way an analyst would.
Founder
The person behind datawatongchal.
15+ years of leadership in geospatial AI — drone and satellite imagery analysis, deep learning, and large-scale national R&D programs across agriculture, disaster monitoring, and infrastructure.
Previously Executive Director & Head of R&D at Innopam (2018–2024) and Head of R&D at Korea IMU (2012–2017). KOICA overseas volunteer for geospatial information (Dominican Republic, 2007–2009). Visiting Researcher, University of Calgary, Department of Geomatics Engineering (2005–2006).
Doctoral research at the University of Seoul focused on drone imagery and deep learning for automated wintering-vegetable acreage estimation — the direct foundation for datawatongchal’s Crop Monitoring service.
- Ph.D., Geospatial Information Engineering — University of Seoul (2022)
- M.S., Urban Engineering (Geospatial Information) — Gyeongsang National University (2006)
- B.S., Civil Engineering — Gyeongsang National University (2003)
- Hydrogen-fuel-cell drone & AI for crop monitoring and yield prediction — MOLIT (2023)
- GeoAI imagery analysis service — Jeju Province (2023)
- Automated detection of Jeju winter crops — NIA / AI Hub dataset (2023)
- GeoAI urban change detection algorithms — Seoul Digital Foundation (2022)
Office
Find us at Seoul Startup Hub Gongneung.
1F Coworking Space, Seoul Startup Hub Gongneung
27 Dongil-ro 174-gil, Nowon-gu
Seoul, Republic of Korea
서울특별시 노원구 동일로174길 27
1층 코워킹스페이스 (공릉동, 서울창업디딤터)
Approximate location — click the marker or “Open in Google Maps” for directions.
Get in touch
Talk to us.